Report Management
Report Management
Report Management
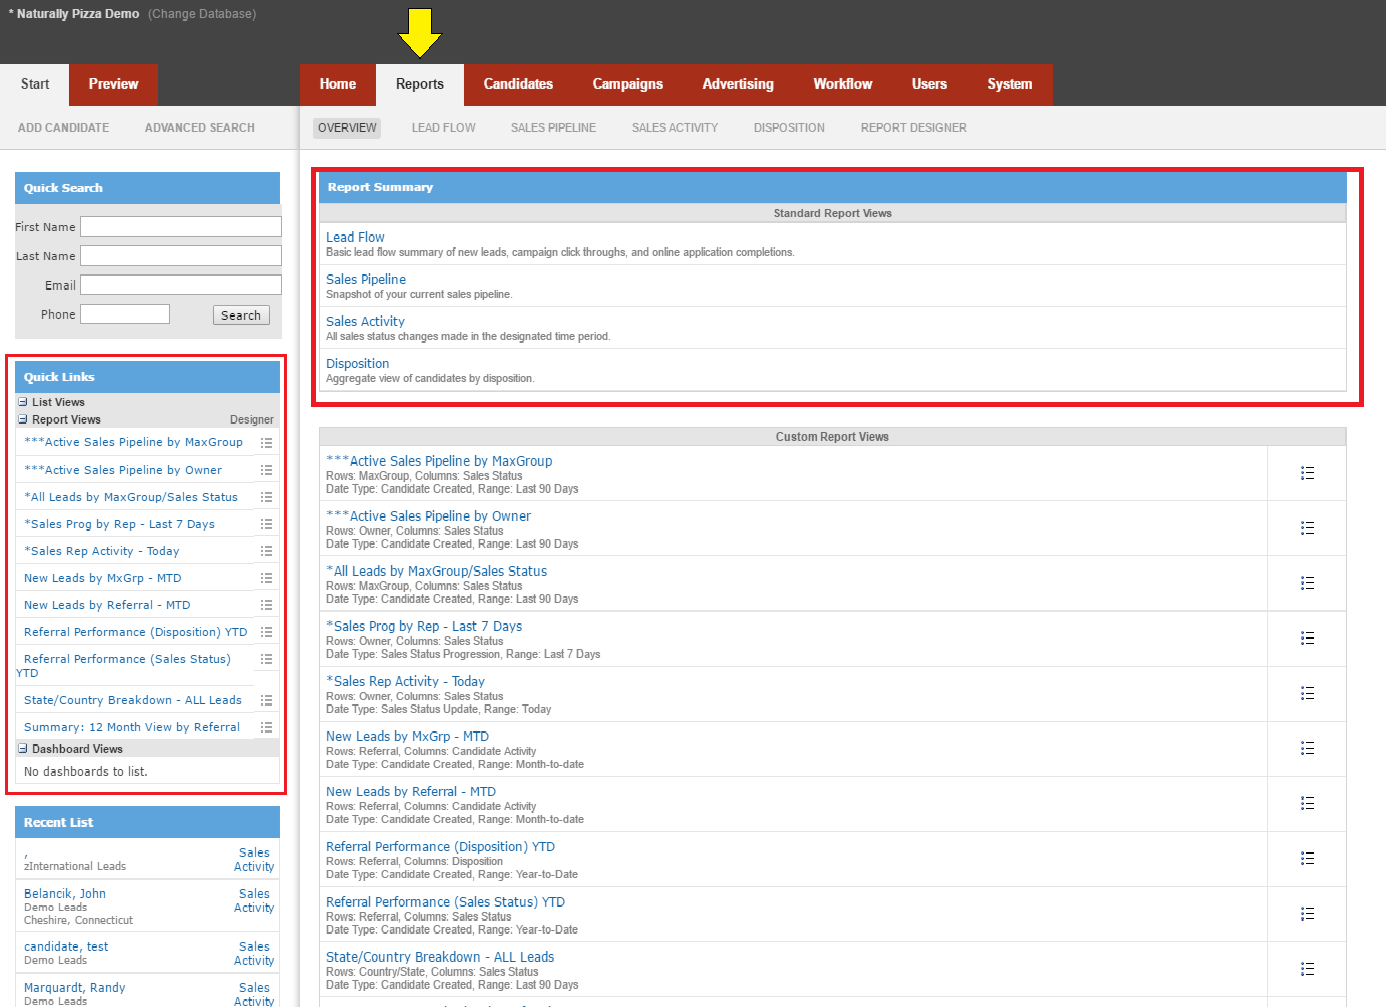
Naranga Lead Management database provides powerful reports that allow you to see how many leads you have and where they are in your pipeline. There are several ways to create and access reports. The first and foremost thing to remember is you can only pull reports on leads you have access to. If you are an Administrator, you will be able to see every lead in the system. The most common ways to access reports are either through the "Reports" tab or by using the "Report Views" under the "Quick Links".

Look carefully, and you will notice the four reports under the "Standard Report Views" are the exact same as the four listed in the links underneath the "Reports" tab. Clicking either one allows you to see the same reports.
The reports are:
Lead Flow: Basic lead flow summary of new leads, campaign click-throughs, and online application completions.
Sales Pipeline: Snapshot of your current sales pipeline.
Sales Activity: All sales status changes are made in the designated time period.
Disposition: Aggregate view of candidates by disposition.
The section under the "Custom Report Views" shows a list of all your custom reports (aka Pivot Views). Many of them are standard in Lead Management when the database is first created, and they are also user-specific. We will cover how to create custom reports later and how to copy them to other users as well later in this document.
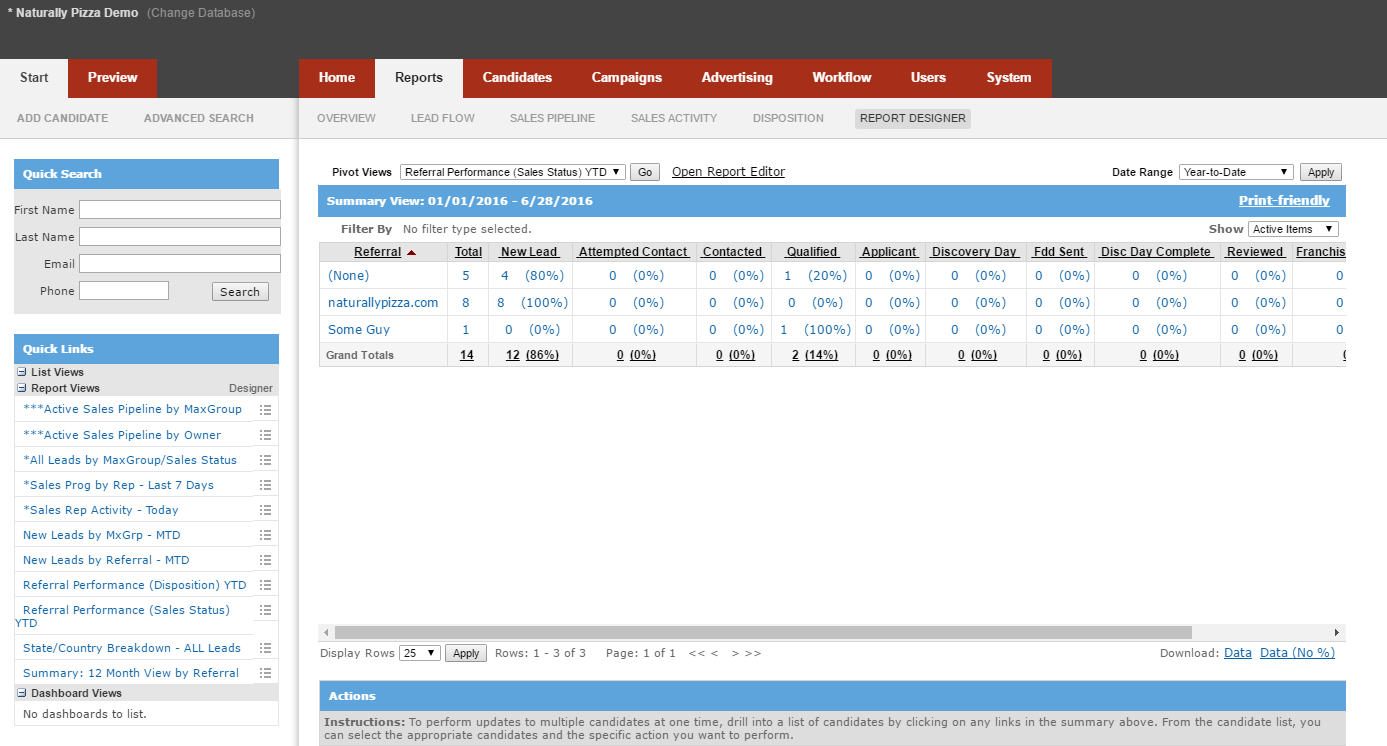
When you pull a pivot view, depending on which one you have used, and your setup, it will look something like this:

There are many dropdown fields to be aware of on this page. They are as follows:
Pivot Views: This will always list the name of the Pivot View you are looking at. You are able to switch to another view by selecting it in the dropdown and hitting the "Go" button.
Date Range: This allows you to set a range of dates to look at leads created in a specific time frame. There are several options that are fairly self-explanatory. The only one that you will need to be careful of is "Custom" which allows you to set your own unique range of dates. We will cover how to set that range a little later.
Show: This dropdown is a filter of what kind of leads to show. In other words, it will only show what is selected. There are three options to choose from.
Active: This will only show active leads. In order for a lead to be marked as "Active" it must be in an active LeadGroup and have an active "Activity Status". Use this setting if you want to see all leads that match these qualifiers.
Pipeline: This will only show leads that are in your Pipeline. In order for a lead to match this qualification, it must both be in a LeadGroup set to "Pipeline: yes" and have a disposition that is still marked as a Pipeline item.
All Items: This will show everything in your database, regardless of LeadGroup status, Activity Status, or Disposition. Use this option if you want to see everything.
Display Rows: From here you can select how many items you want to view in list. The lowest option is "25" and the highest is "500." You have several three other options in between those, of 50, 100, and 250 rows to be displayed.
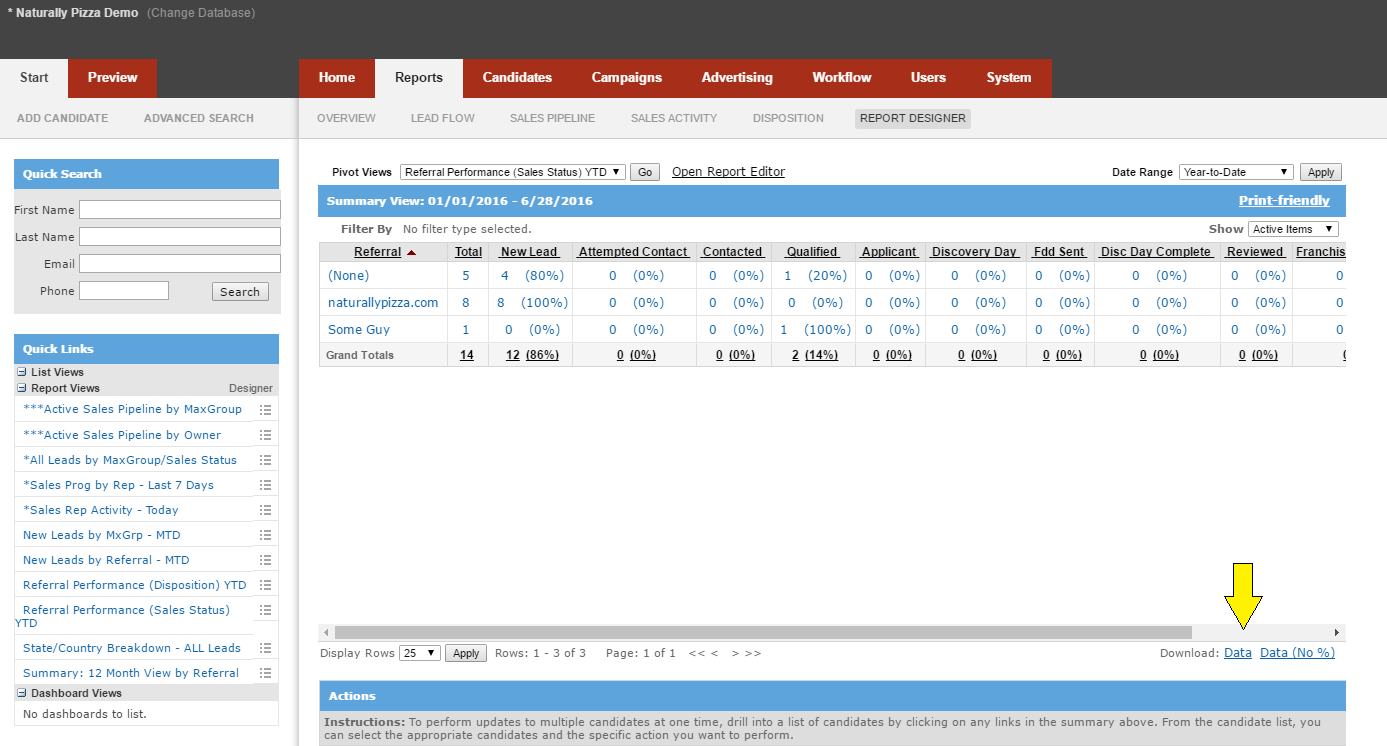
There is one more item on this page you should be aware of, and that is the "Download: Data" link in the lower right-hand corner.

Clicking on this link allows you to download the data displayed in the report into an Excel spreadsheet on your computer. It will only download what is in the current report.
Related Articles
User Management - Lead Management
User Management - Lead Management Managing users in the Lead Management solution is a very simple task. You can handle most of it by clicking on the "Users" tab. This will bring you to the "User List" page, where you can see the status and permission ...What are the five major stages in the lead management lifecycle?
What are the five major stages in the lead management lifecycle? Capture New Leads - The first step is to get leads into the system quickly. Leads can come from just about anywhere - your website, a lead provider, a referral, a marketing list, etc. ...Lead Management API Documentation
Lead Management API Documentation Lead Management API documentation can be found here . For testing, you will need to send an email to help@naranga.com to request the following information: -Username -Password -Client Id -Client Secret In the Swagger ...Lead Management Release Notes 11-21-19
Lead Management Release Notes 11-21-19 This document covers the details of all the enhancements and updates released for Lead Management on November 21, 2019. Main enhancements include: Ability to Merge Candidate ProfilesCreating automated tasks in Naranga Lead Management
Creating automated tasks in Naranga Lead Management Tasks in eMax allow you to send reminder emails to yourself and other users in your system to remind them of certain tasks they must perform to help move your lead through the Pipeline. If you would ...